Creating Gantt Charts with Wrike Project Management Software
To many, a Gantt chart is simply a series of horizontal lines. However, for project managers and planners, a Gantt chart is one of the most valuable and fundamental project management tools available to them to track the timeline of their project. Popular task workflow management software Wrike offers built-in Gantt charts that can prove effective in providing project managers with an instant, high-level view of the progress of each project, plan around key milestones, and prevent delays. They also are incredibly useful for production planning and resource scheduling too.
With Wrike, a collaborative project management software used by thousands of companies worldwide, project managers and planners can easily create a visual Gantt chart online. Once you’ve signed up for an account, it’s time to get moving and set up your Gantt Chart:
- Schedule Your Tasks
In the Task List view of Wrike’s web based scheduling software, you will need to hit the “+ New Task” button to create and schedule all of your project tasks. The quick add feature ensures that this is a seamless process. The calendar icon beside each task enables you to quickly add a start and completion date. You can go back and edit these dates at a later stage.
- Set Your Milestones
When you’re ready for Wrike to draw up your Gantt chart, it’s time to finalise your dates and add your key project milestones. Milestones are rigid dates for final project deliveries handover or product launches. Even if deadlines or priorities change – as will likely be the case at least once during a project – your milestones will remain set in stone.
- Define Your Task Dependencies
Some tasks depend on others to start or finish before that task can be started or completed. In Wrike, setting task dependencies is as easy as dragging and dropping tasks on the Gantt chart. Then, your Gantt chart will automatically move the schedule of connected tasks if the scheduled time or date for one task changes.
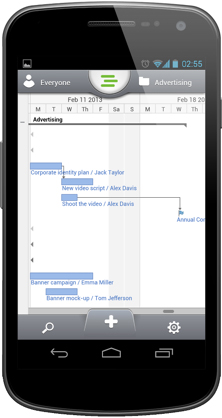
- Real-Time Analysis From Any Device
Once your Gantt Chart is set up, both managers and team members can update project schedules and plans in real time with just a few clicks. Because it’s a cloud-based software, Wrike can be accessed from any web browser, so your Gantt Chart can be updated by managers and team members no matter where they are.
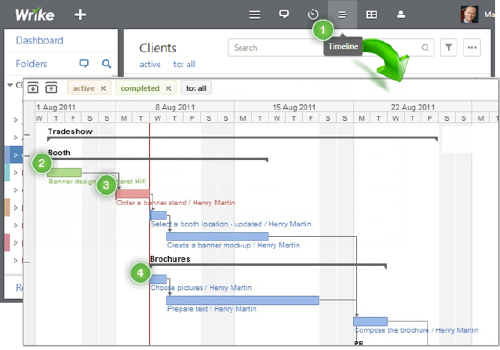
- Project Colour Coding
Wrike Gantt Charts offer project status colour coding so you can check on project timelines and get an instant view of where things stand. Green indicates that tasks have been completed – although you’ll have to select the specific task to see if it was completed on time. Red indicates that a task is overdue, while Blue indicates that a tasks is currently still in progress but not yet overdue.
- Filter Your Results
Start analysing the data most important to you using Wrike filters. Filter down your Gantt Chart data to view project progress based on certain work statuses, specific task owners, dates and several other different criteria.
Gantt Charts make project and resource management super simple, and even more so with the user-friendly, free project management app by Wrike. Gantt charts aren’t only useful for project managers, however. Product development teams, creative directors, and marketing managers all benefit from the organization and visibility into project progress that Gantt charts provide. Wrike even offers a special subscription of its creative agency management software that’s tailor made for marketing and creative teams that includes the Gantt chart feature. Get started creating your own Gantt charts and visual project timelines by signing up for a free trial of Wrike.